ecconf
Statistics of acceptance rates of the main evolutionary computation conferences
This website provides statistics of acceptance rates of the main evolutionary computation conferences for my own interest. I carefully collected data, but some of them may be incorrect. If there are any mistakes, please email me (Ryoji Tanabe, rt.ryoji.tanabe [at] gmail.com) or report an issue from here.
Table of contents
- Upcoming conferences
- CORE2018 rankings
- GECCO: ACM Genetic and Evolutionary Computation Conference
- GECCO (two-page poster papers)
- PPSN: Parallel Problem Solving from Nature
- CEC: IEEE Congress on Evolutionary Computation
- FOGA: ACM/SIGEVO Workshop on Foundations of Genetic Algorithms
- EMO: Conference on Evolutionary Multi-Criterion Optimization
- EvoStar
- EuroGP: EuroGP: European Conference on Genetic Programming
- EvoCOP: European Conference on Evolutionary Computation in Combinatorial Optimisation
- EvoMUSART: International Conference on Artificial Intelligence in Music, Sound, Art and Design
- EvoApplications: International Conference on the Applications of Evolutionary Computation
Upcoming conferences
The date format in the following table is Year.Month.Day. The submission deadline for each conference is based on its first CFP.
| Conference | Venue | Start date | End date | Abstract submission | Paper submission |
|---|---|---|---|---|---|
| Evostar 2026 | Toulouse, France | 2026.04.08 | 2026.04.10 | 2025.11.01 | |
| WCCI 2026 | Maastricht, Netherlands | 2026.06.21 | 2026.06.26 | 2026.01.31 | |
| GECCO 2026 | San Jose, Costa Rica | 2026.07.13 | 2026.07.17 | 2026.01.19 | 2026.01.26 |
| PPSN 2026 | Trento, Italy | 2026.08.29 | 2026.09.02 | 2026.03.28 | |
| EMO 2027 | Exeter, UK | 2027.03.?? | 2027.03.?? | 2026.??.?? | |
| CEC 2027 | Edinburgh, UK | 2027.0?.?? | 2027.0?.?? | 2027.0?.?? | |
| FOGA 2027 | Somewhere in this world | 2027.0?.?? | 2027.0?.?? | 2027.0?.0? |
CORE2021 rankings
| Conference | CORE2021 |
|---|---|
| FOGA | A |
| GECCO | A |
| PPSN | A |
| EuroGP | B |
| EvoCOP | B |
| EvoApplications | B |
| CEC | B |
GECCO: ACM Genetic and Evolutionary Computation Conference
References
- SIGEVOlution (volume 10, issue 3)
- The front matter of each GECCO proceeding
Note
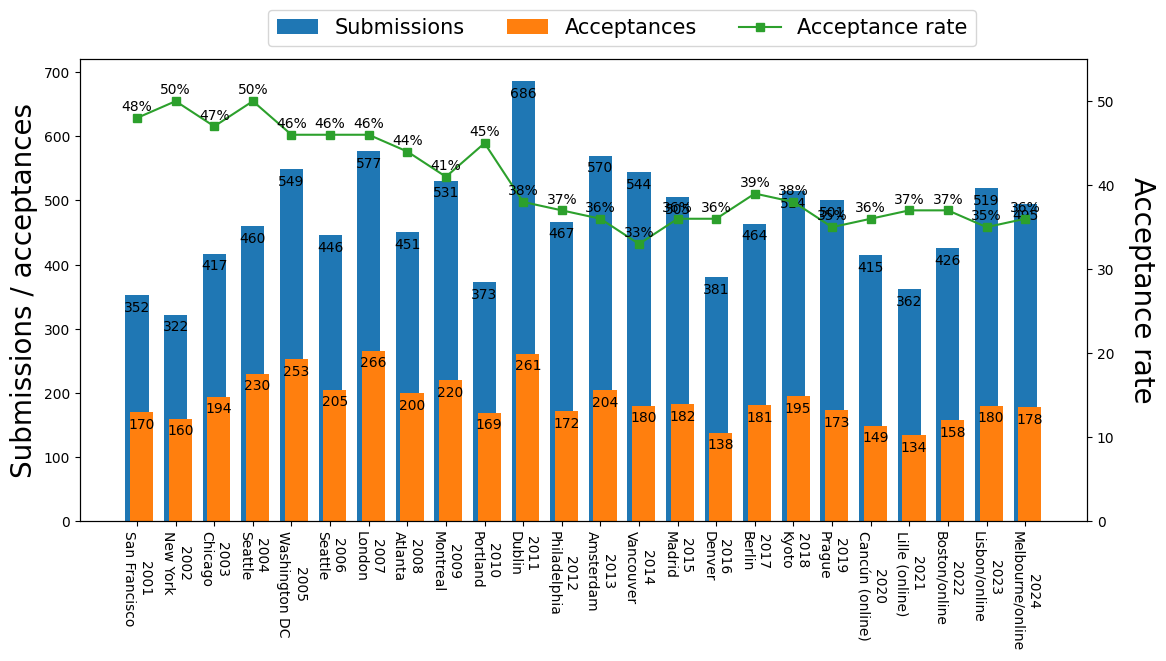
This table provides statistics of full papers, not two-page poster papers.
| Year | Submission | Acceptance | Acceptance rate | Place |
| 2001 | 352 | 170 | 48% | San Francisco |
| 2002 | 322 | 160 | 50% | New York |
| 2003 | 417 | 194 | 47% | Chicago |
| 2004 | 460 | 230 | 50% | Seattle |
| 2005 | 549 | 253 | 46% | Washington DC |
| 2006 | 446 | 205 | 46% | Seattle |
| 2007 | 577 | 266 | 46% | London |
| 2008 | 451 | 200 | 44% | Atlanta |
| 2009 | 531 | 220 | 41% | Montreal |
| 2010 | 373 | 169 | 45% | Portland |
| 2011 | 686 | 261 | 38% | Dublin |
| 2012 | 467 | 172 | 37% | Philadelphia |
| 2013 | 570 | 204 | 36% | Amsterdam |
| 2014 | 544 | 180 | 33% | Vancouver |
| 2015 | 505 | 182 | 36% | Madrid |
| 2016 | 381 | 138 | 36% | Denver |
| 2017 | 464 | 181 | 39% | Berlin |
| 2018 | 514 | 195 | 38% | Kyoto |
| 2019 | 501 | 173 | 35% | Prague |
| 2020 | 415 | 149 | 36% | Cancún (online) |
| 2021 | 362 | 134 | 37% | Lille (online) |
| 2022 | 426 | 158 | 37% | Boston (hybrid) |
| 2023 | 519 | 180 | 35% | Lisbon (hybrid) |
| 2024 | 497 | 178 | 36% | Melbourne (hybrid) |
| 2025 | 501 | 181 | 36% | Málaga (hybrid) |
GECCO two-page poster papers
References
- The front matter of each GECCO proceeding
Note
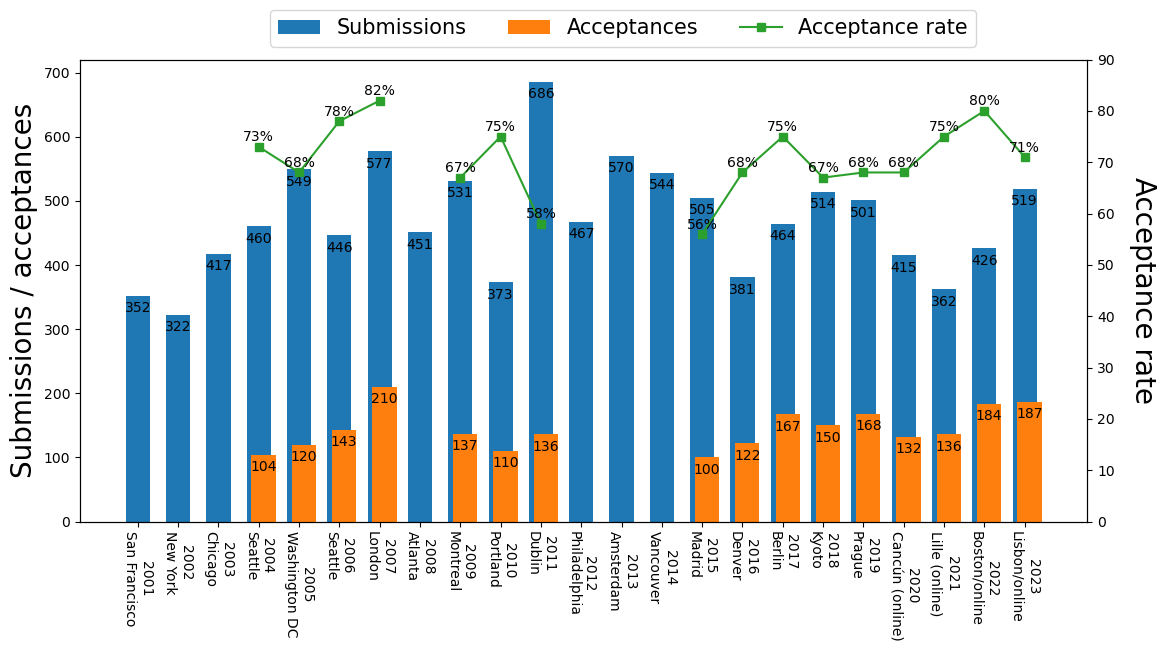
This table provides statistics of two-page poster papers, not full papers. Unlike other conferences in the field of evolutionary computation (e.g., CEC, EMO, and Evo*), poster papers and full papers are published individually in GECCO. While full papers are published in the main volume, poster papers are published in the companion volume (dblp).
It is not obvious how to calculate the acceptance rates of GECCO poster papers. I calculated the acceptance rate for each year as follows: (x + y) / z, where x is the number of full paper acceptances, y is the number of poster paper acceptances, and z is the number of submissions. I believe that the acceptance rate obtained in this way is inexact, but a good approximation.
| Year | Submission | Acceptance | Acceptance-full | Acceptance rate | Place |
| 2001 | 352 | Na | 170 | Na | San Francisco |
| 2002 | 322 | Na | 160 | Na | New York |
| 2003 | 417 | Na | 194 | Na | Chicago |
| 2004 | 460 | 104 | 230 | 73% | Seattle |
| 2005 | 549 | 120 | 253 | 68% | Washington DC |
| 2006 | 446 | 143 | 205 | 78% | Seattle |
| 2007 | 577 | 210 | 266 | 82% | London |
| 2008 | 451 | Na | 200 | Na | Atlanta |
| 2009 | 531 | 137 | 220 | 67% | Montreal |
| 2010 | 373 | 110 | 169 | 75% | Portland |
| 2011 | 686 | 136 | 261 | 58% | Dublin |
| 2012 | 467 | Na | 172 | Na | Philadelphia |
| 2013 | 570 | Na | 204 | Na | Amsterdam |
| 2014 | 544 | Na | 180 | Na | Vancouver |
| 2015 | 505 | 100 | 182 | 56% | Madrid |
| 2016 | 381 | 122 | 138 | 68% | Denver |
| 2017 | 464 | 167 | 181 | 75% | Berlin |
| 2018 | 514 | 150 | 195 | 67% | Kyoto |
| 2019 | 501 | 168 | 173 | 68% | Prague |
| 2020 | 415 | 132 | 149 | 68% | Cancún (online) |
| 2021 | 362 | 136 | 134 | 75% | Lille (online) |
| 2022 | 426 | 184 | 158 | 80% | Boston |
| 2023 | 519 | 187 | 180 | 71% | Lisbon |
| 2024 | 497 | 160 | 178 | 68% | Melbourne |
| 2025 | 501 | 218 | 181 | 80% | Málaga |
PPSN: Parallel Problem Solving from Nature
References
- SIGEVOlution (volume 11, issue 3)
- The front matter of each PPSN proceeding
Note
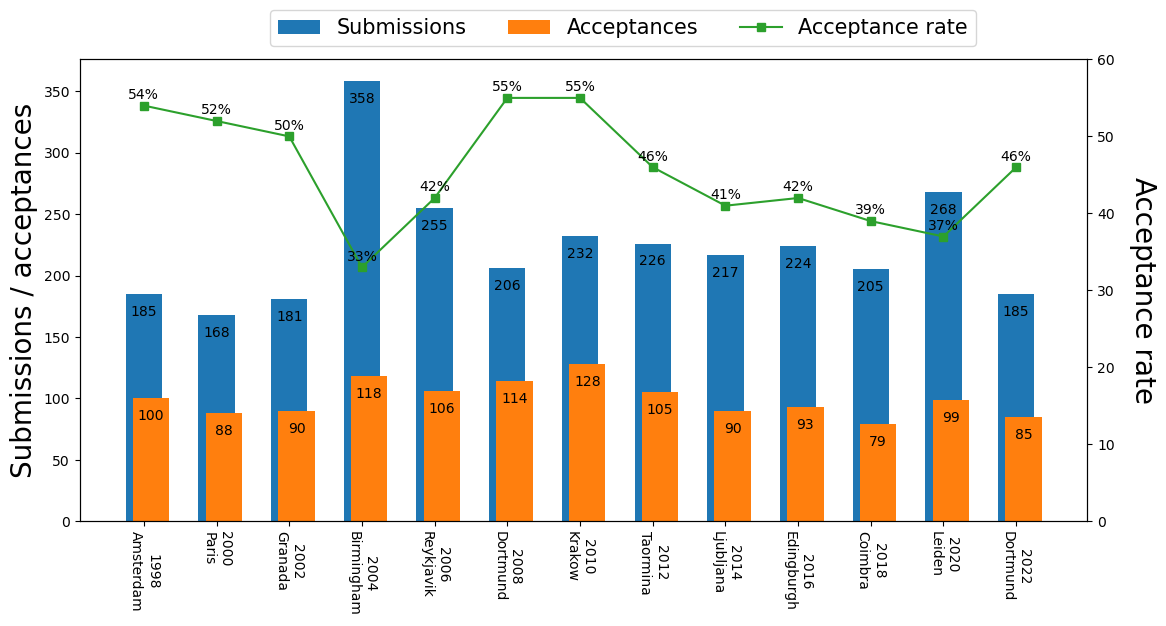
PPSN is held in even years.
| Year | Submission | Acceptance | Acceptance rate | Place |
| 1998 | 185 | 100 | 54% | Amsterdam |
| 2000 | 168 | 88 | 52% | Paris |
| 2002 | 181 | 90 | 50% | Granada |
| 2004 | 358 | 118 | 33% | Birmingham |
| 2006 | 255 | 106 | 42% | Reykjavik |
| 2008 | 206 | 114 | 55% | Dortmund |
| 2010 | 232 | 128 | 55% | Krakow |
| 2012 | 226 | 105 | 46% | Taormina |
| 2014 | 217 | 90 | 41% | Ljubljana |
| 2016 | 224 | 93 | 42% | Edingburgh |
| 2018 | 205 | 79 | 39% | Coimbra |
| 2020 | 268 | 99 | 37% | Leiden |
| 2022 | 185 | 85 | 46% | Dortmund |
| 2024 | 294 | 101 | 34% | Hagenberg |
CEC: IEEE Congress on Evolutionary Computation
References
- A review written by Prof. Hisao Ishibuchi and Prof. Hisashi Handa (in Japanese)
- The CEC/WCCI conference reports in the IEEE CIM
Note
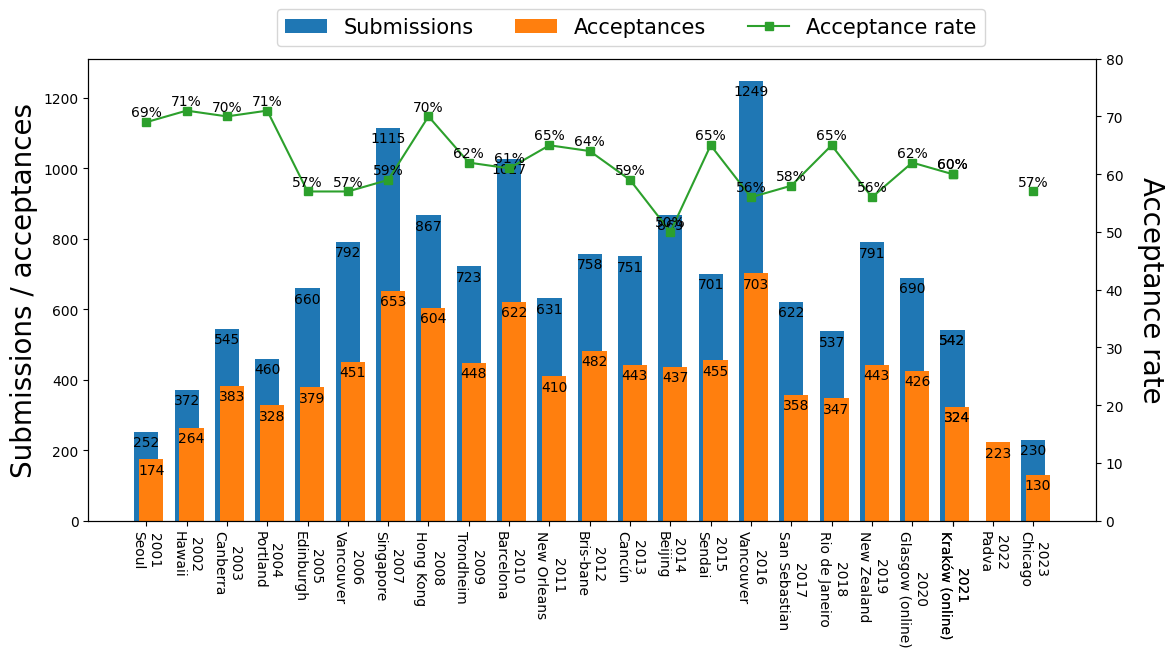
CEC is held as part of WCCI in even years.
| Year | Submission | Acceptance | Acceptance rate | Place |
| 2001 | 252 | 174 | 69% | Seoul |
| 2002 | 372 | 264 | 71% | Hawaii |
| 2003 | 545 | 383 | 70% | Canberra |
| 2004 | 460 | 328 | 71% | Portland |
| 2005 | 660 | 379 | 57% | Edinburgh |
| 2006 | 792 | 451 | 57% | Vancouver |
| 2007 | 1115 | 653 | 59% | Singapore |
| 2008 | 867 | 604 | 70% | Hong Kong |
| 2009 | 723 | 448 | 62% | Trondheim |
| 2010 | 1027 | 622 | 61% | Barcelona |
| 2011 | 631 | 410 | 65% | New Orleans |
| 2012 | 758 | 482 | 64% | Bris-bane |
| 2013 | 751 | 443 | 59% | Cancún |
| 2014 | 869 | 437 | 50% | Beijing |
| 2015 | 701 | 455 | 65% | Sendai |
| 2016 | 1249 | 703 | 56% | Vancouver |
| 2017 | 622 | 358 | 58% | San Sebastian |
| 2018 | 537 | 347 | 65% | Rio de Janeiro |
| 2019 | 791 | 443 | 56% | New Zealand |
| 2020 | 690 | 426 | 62% | Glasgow (online) |
| 2021 | 542 | 324 | 60% | Kraków (online) |
| 2022 | Na | 223 | Na | Padva |
| 2023 | 230 | 130 | 57% | Chicago |
| 2024 | 665 | 350 | 53% | Yokohama |
FOGA: ACM/SIGEVO Workshop on Foundations of Genetic Algorithms
References
- The front matter of each FOGA proceeding
Note
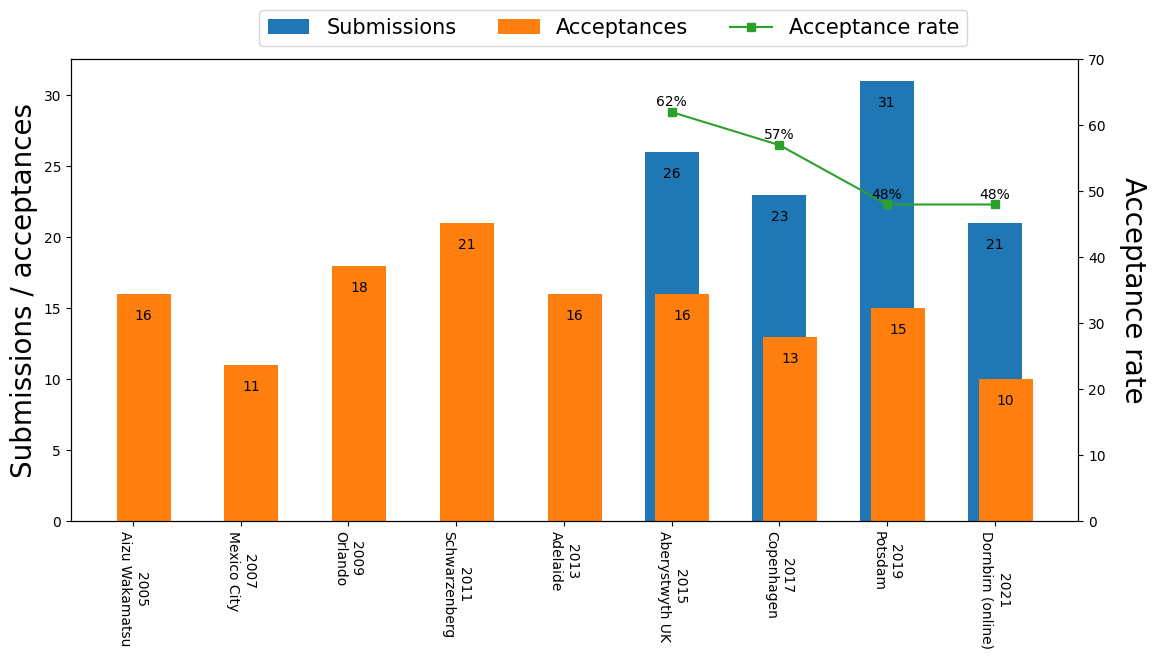
FOGA has been held in odd years since 2005. Statistics of most FOGA conferences are missing. Although proceedings of FOGA1990 – FOGA2002 were published by Morgan Kaufmann Publishers, they are currently unavailable.
| Year | Submission | Acceptance | Acceptance rate | Place |
| 2005 | Na | 16 | Na | Aizu Wakamatsu |
| 2007 | Na | 11 | Na | Mexico City |
| 2009 | Na | 18 | Na | Orlando |
| 2011 | Na | 21 | Na | Schwarzenberg |
| 2013 | Na | 16 | Na | Adelaide |
| 2015 | 26 | 16 | 62% | Aberystwyth UK |
| 2017 | 23 | 13 | 57% | Copenhagen |
| 2019 | 31 | 15 | 48% | Potsdam |
| 2021 | 21 | 10 | 48% | Dornbirn (online) |
| 2023 | 27 | 14 | 52% | Potsdam |
| 2025 | 56 | 26 | 46% | Leiden |
EMO: Conference on Evolutionary Multi-Criterion Optimization
References
- The front matter of each EMO proceeding
Note
EMO is held in odd years.
| Year | Submission | Acceptance | Acceptance rate | Place |
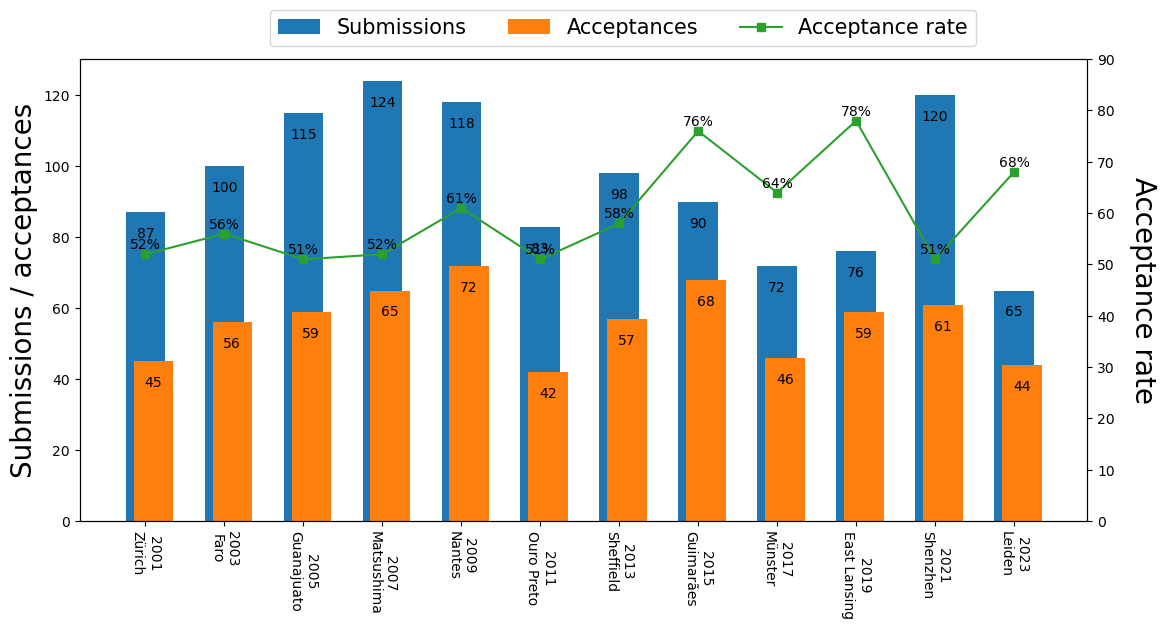
| 2001 | 87 | 45 | 52% | Zürich |
| 2003 | 100 | 56 | 56% | Faro |
| 2005 | 115 | 59 | 51% | Guanajuato |
| 2007 | 124 | 65 | 52% | Matsushima |
| 2009 | 118 | 72 | 61% | Nantes |
| 2011 | 83 | 42 | 51% | Ouro Preto |
| 2013 | 98 | 57 | 58% | Sheffield |
| 2015 | 90 | 68 | 76% | Guimarães |
| 2017 | 72 | 46 | 64% | Münster |
| 2019 | 76 | 59 | 78% | East Lansing |
| 2021 | 120 | 61 | 51% | Shenzhen |
| 2023 | 65 | 44 | 68% | Leiden |
| 2025 | 57 | 38 | 67% | Canberra |
EuroGP: European Conference on Genetic Programming
References
- The front matter of each EuroGP proceeding
Note
EuroGP is held as part of EvoStar, which consists of EuroGP, EvoApplications, EvoCOP, and EvoMUSART.
| Year | Submission | Acceptance | Acceptance rate | Place |
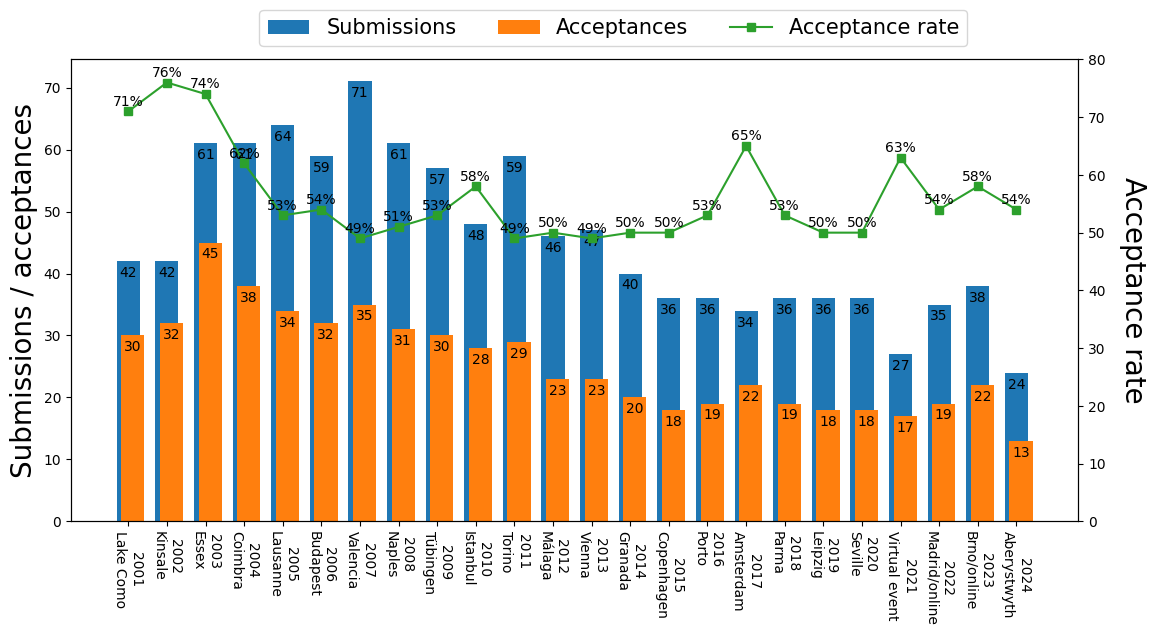
| 2001 | 42 | 30 | 71% | Lake Como |
| 2002 | 42 | 32 | 76% | Kinsale |
| 2003 | 61 | 45 | 74% | Essex |
| 2004 | 61 | 38 | 62% | Coimbra |
| 2005 | 64 | 34 | 53% | Lausanne |
| 2006 | 59 | 32 | 54% | Budapest |
| 2007 | 71 | 35 | 49% | Valencia |
| 2008 | 61 | 31 | 51% | Naples |
| 2009 | 57 | 30 | 53% | Tübingen |
| 2010 | 48 | 28 | 58% | Istanbul |
| 2011 | 59 | 29 | 49% | Torino |
| 2012 | 46 | 23 | 50% | Málaga |
| 2013 | 47 | 23 | 49% | Vienna |
| 2014 | 40 | 20 | 50% | Granada |
| 2015 | 36 | 18 | 50% | Copenhagen |
| 2016 | 36 | 19 | 53% | Porto |
| 2017 | 34 | 22 | 65% | Amsterdam |
| 2018 | 36 | 19 | 53% | Parma |
| 2019 | 36 | 18 | 50% | Leipzig |
| 2020 | 36 | 18 | 50% | Seville |
| 2021 | 27 | 17 | 63% | Virtual event |
| 2022 | 35 | 19 | 54% | Madrid/online |
| 2023 | 38 | 22 | 58% | Brno/online |
| 2024 | 24 | 13 | 54% | Aberystwyth |
| 2025 | 27 | 15 | 56% | Trieste |
EvoCOP: European Conference on Evolutionary Computation in Combinatorial Optimisation
References
Note
EvoCOP is held as part of EvoStar, which consists of EuroGP, EvoApplications, EvoCOP, and EvoMUSART.
| Year | Submission | Acceptance | Acceptance rate | Place |
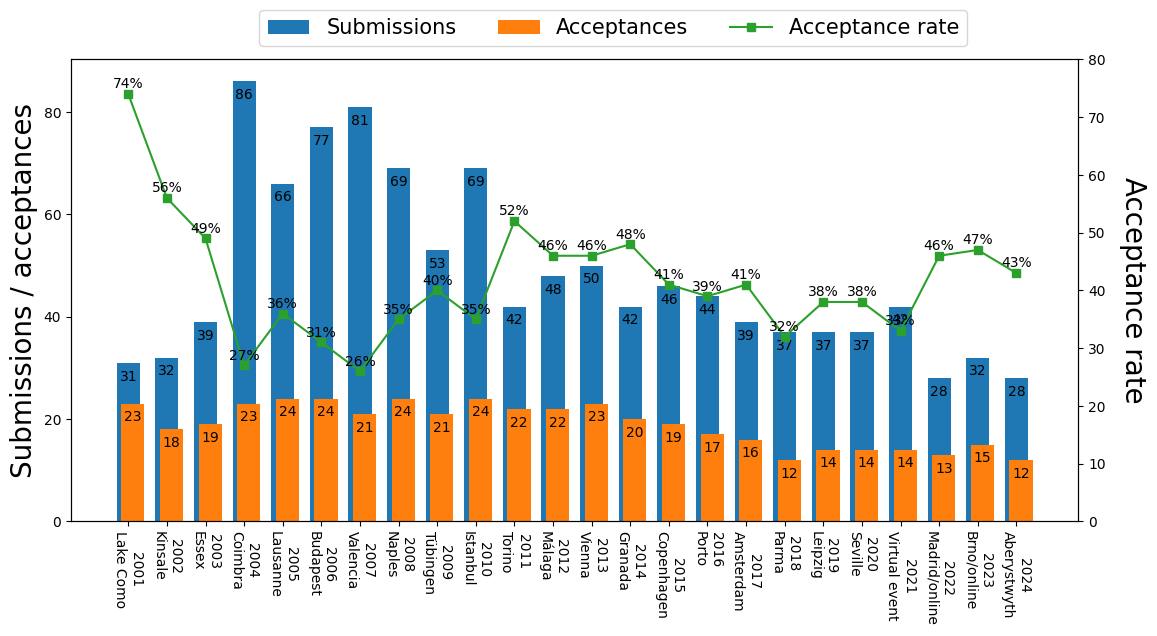
| 2001 | 31 | 23 | 74% | Lake Como |
| 2002 | 32 | 18 | 56% | Kinsale |
| 2003 | 39 | 19 | 49% | Essex |
| 2004 | 86 | 23 | 27% | Coimbra |
| 2005 | 66 | 24 | 36% | Lausanne |
| 2006 | 77 | 24 | 31% | Budapest |
| 2007 | 81 | 21 | 26% | Valencia |
| 2008 | 69 | 24 | 35% | Naples |
| 2009 | 53 | 21 | 40% | Tübingen |
| 2010 | 69 | 24 | 35% | Istanbul |
| 2011 | 42 | 22 | 52% | Torino |
| 2012 | 48 | 22 | 46% | Málaga |
| 2013 | 50 | 23 | 46% | Vienna |
| 2014 | 42 | 20 | 48% | Granada |
| 2015 | 46 | 19 | 41% | Copenhagen |
| 2016 | 44 | 17 | 39% | Porto |
| 2017 | 39 | 16 | 41% | Amsterdam |
| 2018 | 37 | 12 | 32% | Parma |
| 2019 | 37 | 14 | 38% | Leipzig |
| 2020 | 37 | 14 | 38% | Seville |
| 2021 | 42 | 14 | 33% | Virtual event |
| 2022 | 28 | 13 | 46% | Madrid/online |
| 2023 | 32 | 15 | 47% | Brno/online |
| 2024 | 28 | 12 | 43% | Aberystwyth |
| 2025 | 43 | 16 | 37% | Trieste |
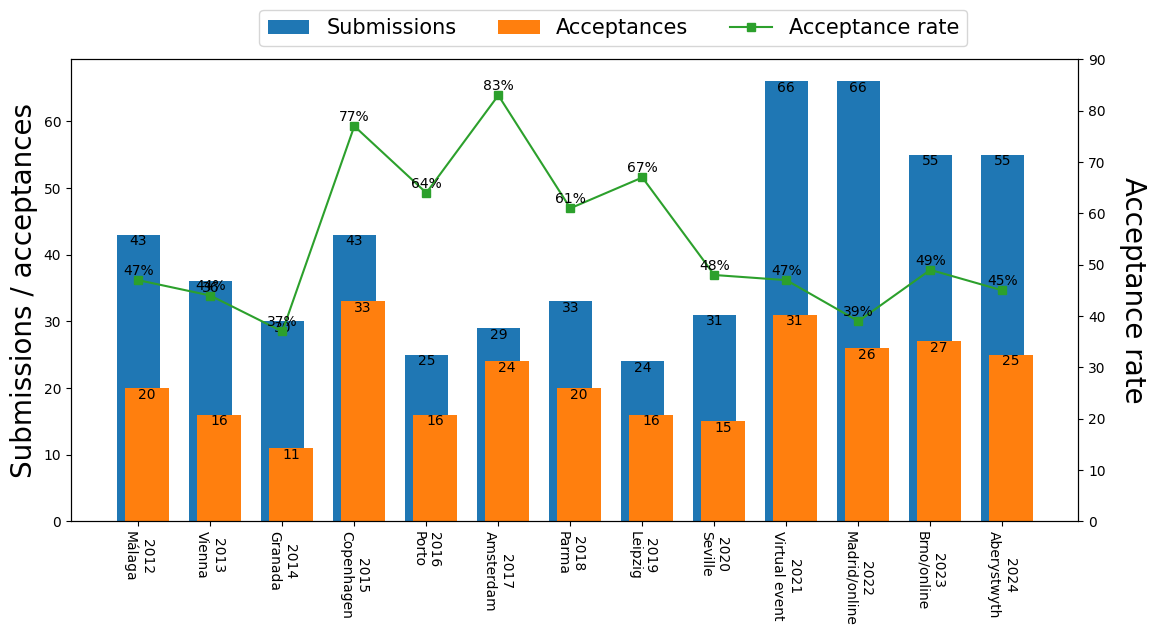
EvoMUSART: International Conference on Artificial Intelligence in Music, Sound, Art and Design
References
- The front matter of each EvoMUSART proceeding
Note
EvoMUSART is held as part of EvoStar, which consists of EuroGP, EvoApplications, EvoCOP, and EvoMUSART.
| Year | Submission | Acceptance | Acceptance rate | Place |
| 2012 | 43 | 20 | 47% | Málaga |
| 2013 | 36 | 16 | 44% | Vienna |
| 2014 | 30 | 11 | 37% | Granada |
| 2015 | 43 | 33 | 77% | Copenhagen |
| 2016 | 25 | 16 | 64% | Porto |
| 2017 | 29 | 24 | 83% | Amsterdam |
| 2018 | 33 | 20 | 61% | Parma |
| 2019 | 24 | 16 | 67% | Leipzig |
| 2020 | 31 | 15 | 48% | Seville |
| 2021 | 66 | 31 | 47% | Virtual event |
| 2022 | 66 | 26 | 39% | Madrid/online |
| 2023 | 55 | 27 | 49% | Brno/online |
| 2024 | 55 | 25 | 45% | Aberystwyth |
| 2025 | 52 | 28 | 54% | Trieste |
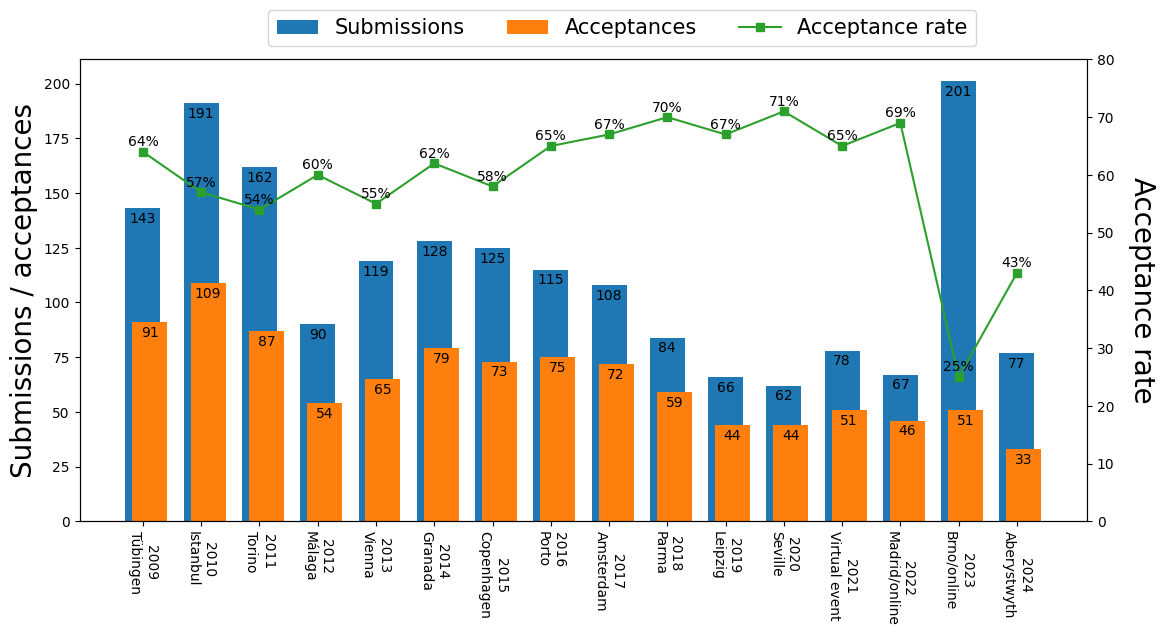
EvoApplications: International Conference on the Applications of Evolutionary Computation
References
- The front matter of each EvoApplications proceeding
Note
EvoApplications is held as part of EvoStar, which consists of EuroGP, EvoApplications, EvoCOP, and EvoMUSART. According to Wikipedia, EvoApplications had been known as EvoWorkshops by 2008.
| Year | Submission | Acceptance | Acceptance rate | Place |
| 2009 | 143 | 91 | 64% | Tübingen |
| 2010 | 191 | 109 | 57% | Istanbul |
| 2011 | 162 | 87 | 54% | Torino |
| 2012 | 90 | 54 | 60% | Málaga |
| 2013 | 119 | 65 | 55% | Vienna |
| 2014 | 128 | 79 | 62% | Granada |
| 2015 | 125 | 73 | 58% | Copenhagen |
| 2016 | 115 | 75 | 65% | Porto |
| 2017 | 108 | 72 | 67% | Amsterdam |
| 2018 | 84 | 59 | 70% | Parma |
| 2019 | 66 | 44 | 67% | Leipzig |
| 2020 | 62 | 44 | 71% | Seville |
| 2021 | 78 | 51 | 65% | Virtual event |
| 2022 | 67 | 46 | 69% | Madrid/online |
| 2023 | 201 | 51 | 25% | Brno/online |
| 2024 | 77 | 33 | 43% | Aberystwyth |
| 2025 | 104 | 68 | 65% | Trieste |
